Garmin Scuba Sensor
Problem
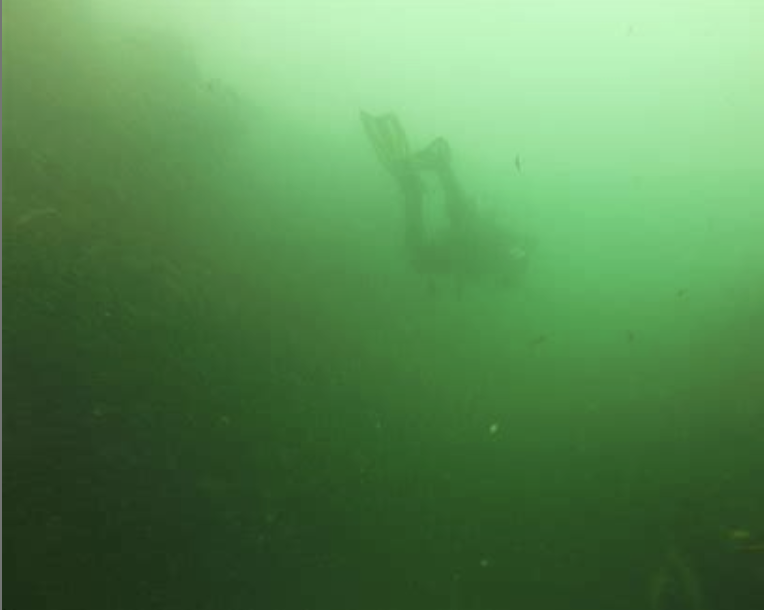
Scuba divers record how far they are able to see underwater after each dive. However, most divers estimate in 5-10 foot increments, leading to unreliable data. Garmin sought out a product to measure and collect data on the water visibility experienced by divers.
Design Criteria
Waterproof to an IPX8 Rating
Pressure resistant at 60 ft of depth
Battery life of at least 1.5 hours
Visibility data displayed to the user wirelessly
Ease of use: 90% of users state that the device was easy to attach and the data was easy to interpret
Wireless charging method
Solution
How Does It Work?
- Diver attaches the sensor to their Buoyancy Control Device
- Diver presses the "On/Off" button to turn on the device
- Diver presses the "Data" button to start logging visibility data and begins their dive
- Diver concludes dive and presses the "Data" button again to stop data collection
- Diver presses the "Upload" button and views their data via a Google Sheet
- Diver presses the "On/Off" button to turn off the device
- Diver places device on the charging stand to recharge wirelessly
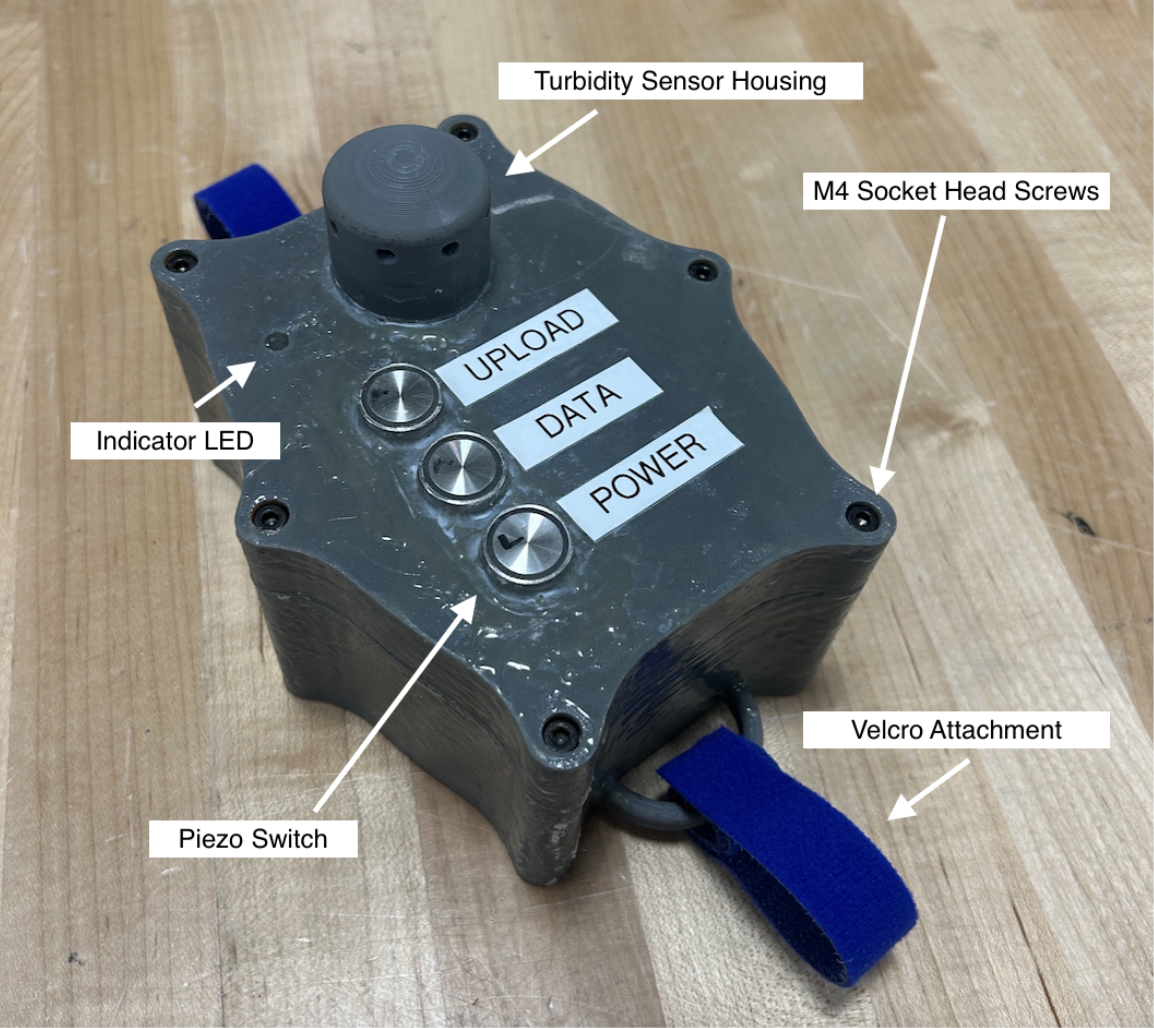
Key Components
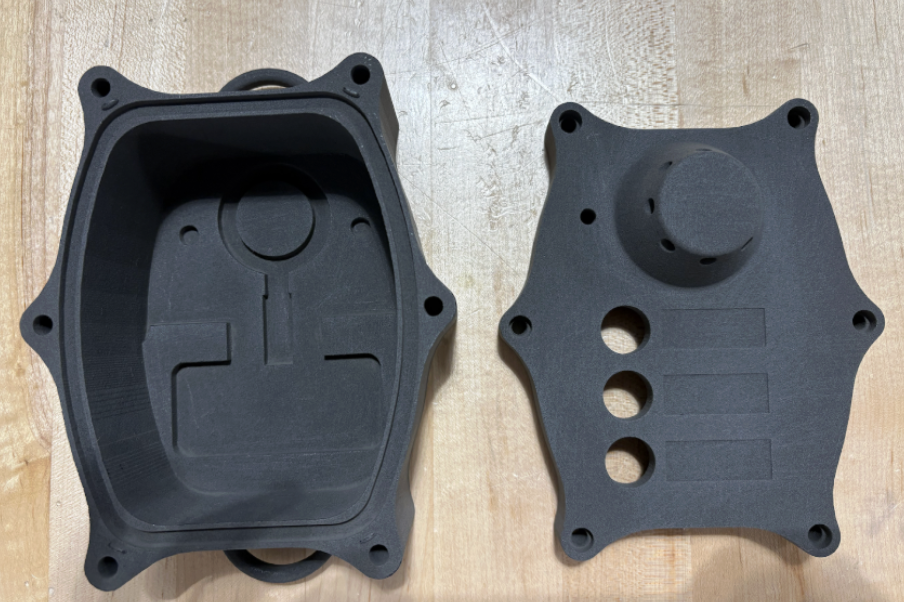
Nylon SLS Printed Housing
- •Slots to hold induction charger and battery in place to promote durability
- •Slots for the piezoelectric button switches and LED indicator
- •Groove for gasket
- •Holes for the M4 socket head screws
- •Notches to lock the lid in place
- •Covering for the turbidity sensor to limit exposure to ambient light
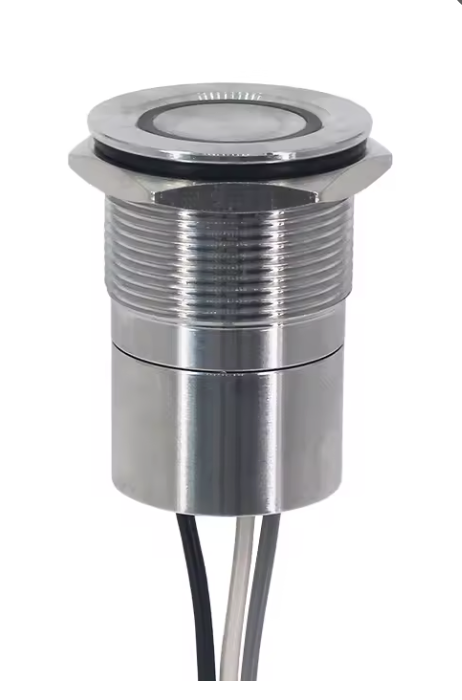
Piezoelectric Buttons for Underwater Use
- •On/Off power switch
- •Data collection switch
- •Data upload switch
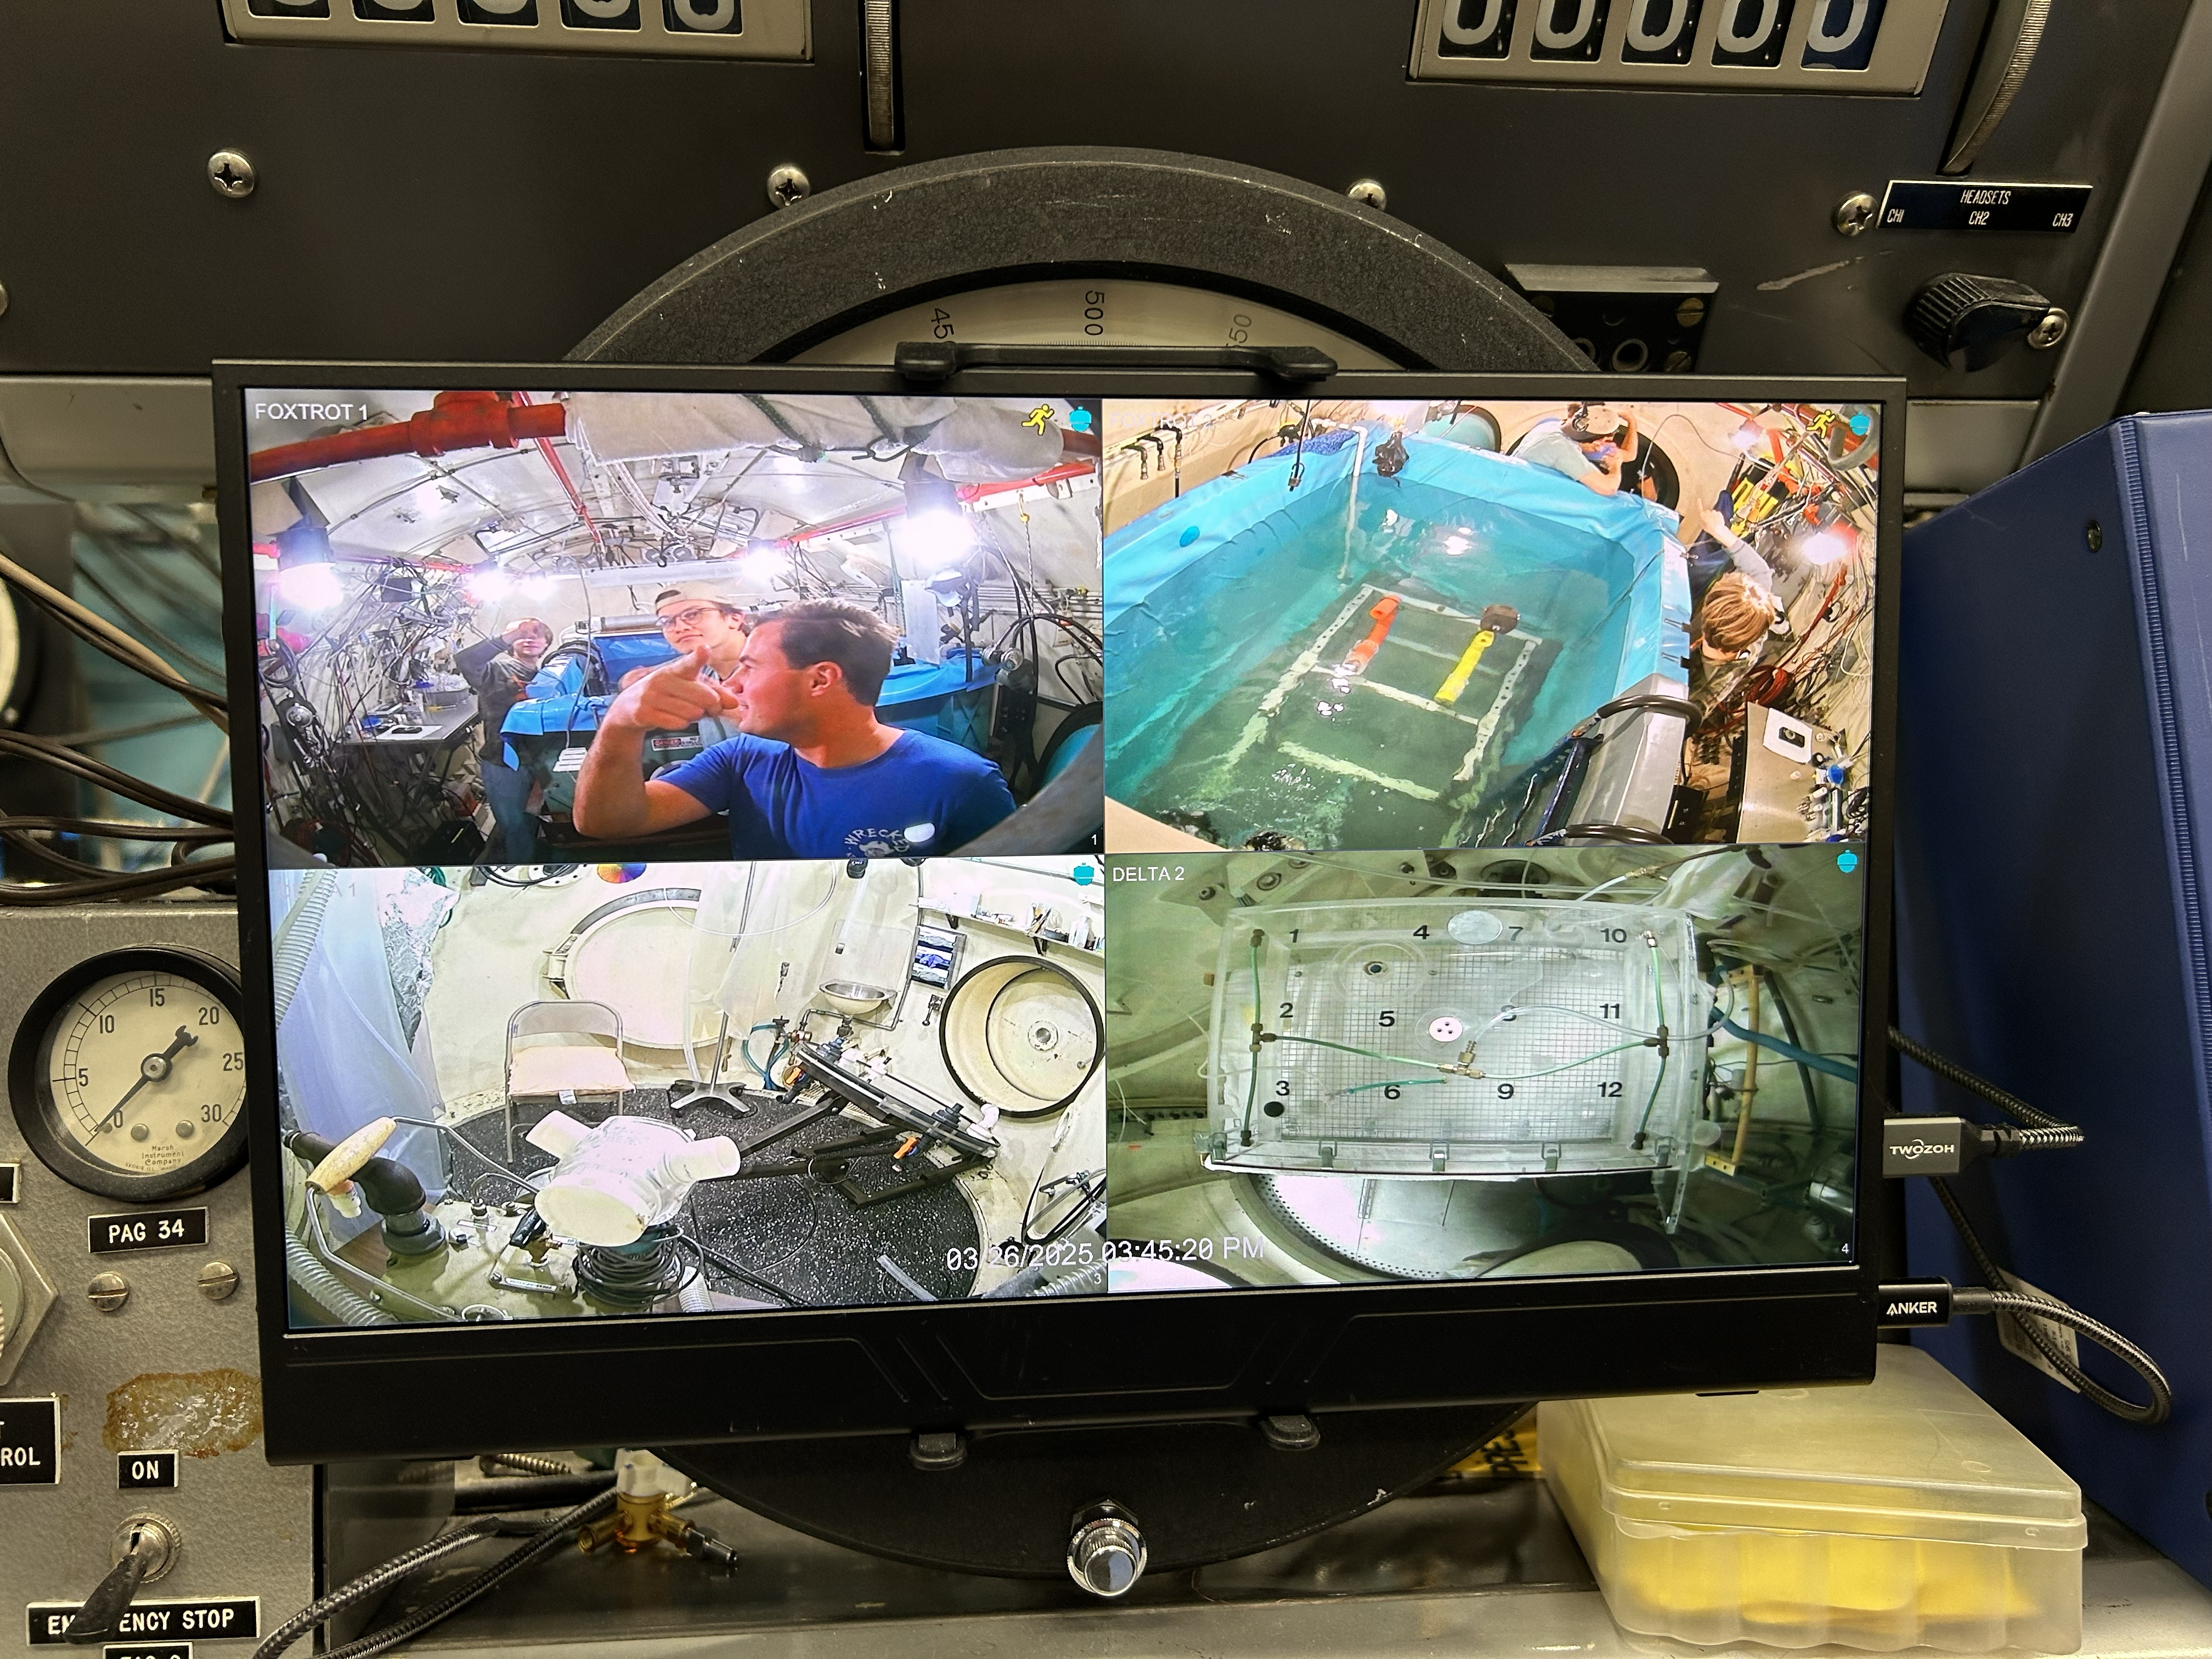
Gasket
- •Flat silicone 50A gasket and V-ridge design
- •Screws located outside the gasket to eliminate leak paths
- •Tested underwater in Duke's Hyperbaric Chamber
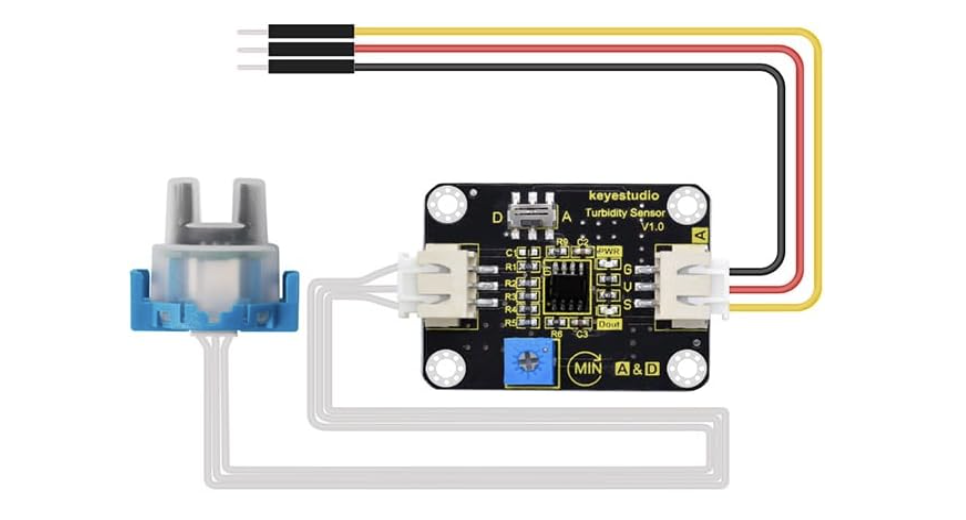
Turbidity Sensor
- •Detects cloudiness of water by emitting light from one prong and receiving light in the other
- •A lower amount of light detected by the receiver (which occurs in cloudier water) leads to a lower output voltage
Turbidity to Visibility Correlation
- •Correlates the cloudiness detected by the sensor to how far the diver can see underwater
- •Created by collecting visibility data and sensor voltage readings at multiple NC lakes and calculating the relationship
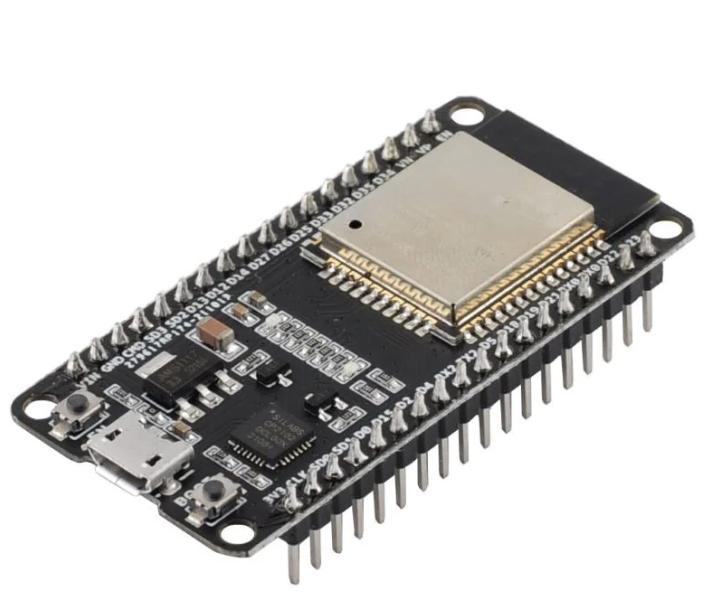
ESP32 and SD Card
- •Uploads data to a Google Sheet user interface via Bluetooth
- •Logs data to SD card for redundancy
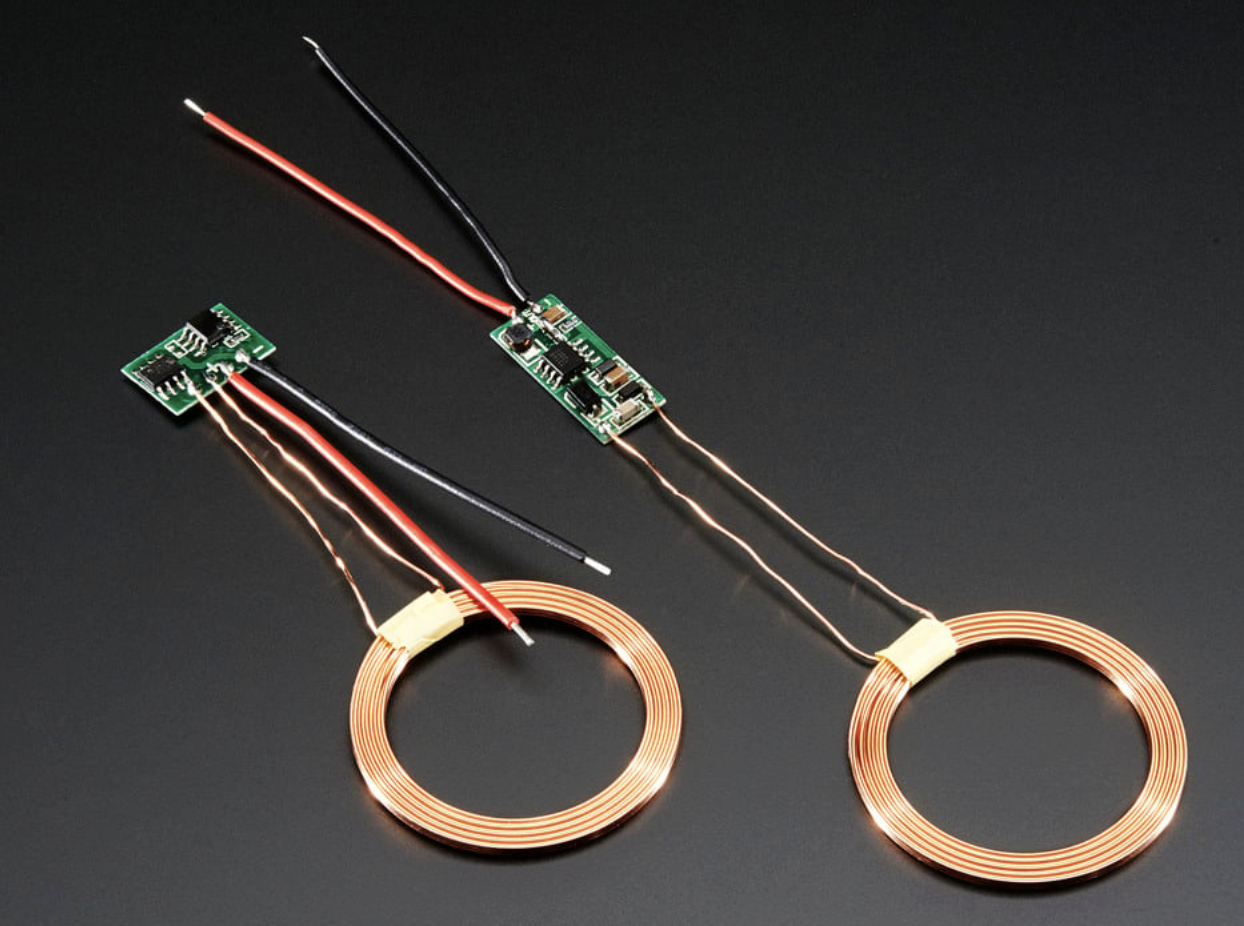
Induction Charger and Charging Stand
- •Wireless charging to minimize ports and potential leak paths
- •Device locks into stand to maintain induction charger alignment in rough environments
D-ring and Velcro Attachment
- •Durable velcro that attaches the D-rings on the device to the D-rings on a diver's vest/Buoyancy Control Device
Epoxy Coating
- •Successfully watertight even at 1500 meters (Shoutout Dave Haas, PhD @ FaunaLabs for the recommendation!)
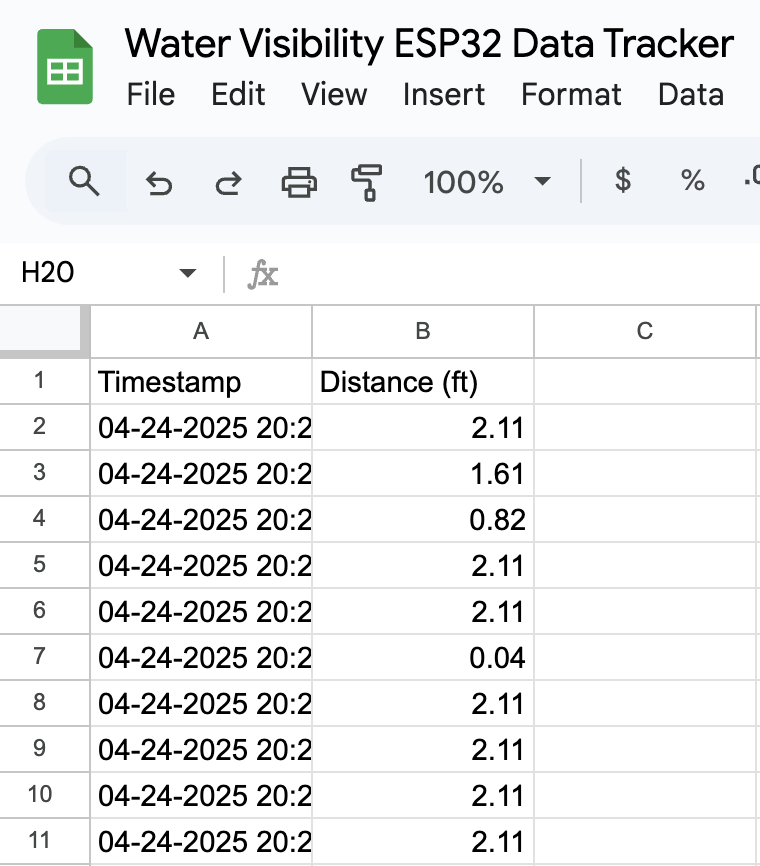
Google Sheets UI
- •Data uploaded wirelessly
- •Easy-to-use Google Sheet format with Time and Distance data
Ainsley Pollock - Engineering Portfolio